
Companies must record and evaluate the items they have in their warehouses in order to set production and sales volume. We are talking about inventory control, a control that can be performed under a permanent or periodic inventory system.
In the periodic system, counts are made at planned intervals to determine the quantity of existing items. This means that the company does not know at any given time how much its items amount to or the cost of those sold. It will only know when the time comes to do the physical count. A supermarket is an example of a business that uses this type of system.
On the other hand, with the permanent or perpetual inventory system we have a record of every unit that enters or leaves the inventory, so we know at all times the cost of inventory sold.
What happens, though, when products are acquired at various prices and on various dates?
The inventory may represent varied values due to the varying dates and prices, which is why there are inventory valuation methods.
Today we continue with warehouse and inventory management. That’s why we touch on a topic that is quite common to many disciplines.
While inventories are already a common subject in themselves, their valuation is a common teaching axis in many careers.
Today for inventory management, we will see what inventory valuation methods are, how they are done and a specific example of each one. This post will be a little bit long so as not to leave any doubt. Let’s get started!
What is inventory valuation?
Some people contend that inventory is a valuable asset. Having them costs money, but they are necessary to ensure continuity in production and service delivery. In order to hold as little inventory as possible without compromising production and customer satisfaction, experts have developed strategies.
In any case, inventory is money that is tied up and needs to be accounted for. This means that the purchase of that inventory (or the one that gets processed) needs to be included in the income statement and balance sheet of the business.
But how do I account for it? That is why we are here. Before moving on to a real-world illustration, let’s first briefly discuss accounting’s methods for inventory valuation.
Inventory valuation methods
Inventory valuation methods allow to determine the “value” of the units that are stored. There are several methods, but the most frequently mentioned are the following:
Method 1: First in, first out (FIFO)
FIFO (first in, first out). It states that the first products to be purchased are the first to be sold, with the most recent items remaining in inventory.
Contrary to LIFO, this method makes the most realistic assumption in practice. It makes the most sense to sell those items that have been in inventory the longest, thus reducing the risk of obsolescence or expiration.
With FIFO, the warehouse’s remaining inventory is valued at a price that is comparable to the market price (considering an inflationary period). In other words, items that have been part of the inventory for a while tend to cost less than those that were just purchased.
The latter is what causes a lower cost of sales, which raises the company’s profit but also increases the amount of taxes owed.
Method 2: Last in, first out (LIFO)
The last units to enter will be the first to be sold in this valuation method, which is the opposite of FIFO.
Since it is the opposite of FIFO, it is not a method that is frequently used in practice but is frequently taught in academic settings.
Why does IFRS not accept LIFO? The reason is that it now places more emphasis on the income statement than the balance sheet.
Not to mention the drawbacks brought on by the characteristics of the items. A company’s inventory may become dated or vulnerable to damage if it decides to run under LIFO.
Therefore, in light of the items’ notable price variations, the method is far from being realistic.
The company will initially sell off the most recent inventory it has—the ones that have just arrived—during an inflationary period, which will result in an undervalued or undervalued inventory.
This suggests that in the case of an inflationary economy, the LIFO method reduces the tax burden.
However, the opposite will happen if the economy experiences a decline in prices (deflation). As the most recent inventory is acquired at lower prices than the older inventory was acquired, it will result in us having an overvalued inventory.
Method 3: Weighted Average
In this method, the cost of the inventories that are currently on hand is averaged; as a result, the average is updated for each unit that enters (those that are purchased).
In other words, this method involves dividing the price of the goods being sold by the quantity of them we have on hand.
Remember that the items that are for sale are a combination of those that were in the initial inventory and those that are being bought.
The amount we arrive at after dividing is used to determine the cost of the initial inventory or the cost of goods sold.
As a result, the value of our inventory is calculated as the sum of the costs of our oldest and most recent purchases.
This method is accepted by International Accounting Standards (IFRS) and Generally Accepted Accounting Principles (GAAP). It is usually one of the most widely used because of its ease of application.
Example inventory valuation
Let’s develop the examples based on the following data:
- On March 4, 215 units are purchased at a price of $110.
- On March 8, 400 units are purchased at a price of $100.
- On March 17, 590 units are sold at a price of $240.
- On March 22, 200 units are purchased at a price of $105.
- On March 30, 175 units are sold at a price of $210.
The costs per unit are shown in the table for each method.
FIFO Example
- We start by saying that the value per unit for the March 4 purchase is $110. Therefore, 215 units purchased at a cost of $110 each, gives us a total of $23,650 in inventory. The units we are left with in inventory are the same 215 units, plus the balance.
- On March 8 we purchased 400 units at a cost of $100 each. Therefore we added $40,000 to our inventory balance. This is likewise reflected in the inventory balance. Take into account the 215 units from the previous transaction that in the event of a sale, will be the first to go.
- Of the 590 units that are sold on March 17, the 215 units that were in inventory at $110 (those of March 4) are sold first, which corresponds to a cost of $23,650 (215 * 110).
- Then the remaining 375 units are sold (from the March 8 purchase) for a selling cost of $37500 (375 * 100). There are 25 units left in inventory.
We proceed in the same way for the rest of the movements. If you get lost, ask in the comments!
This is how our FIFO example is solved:
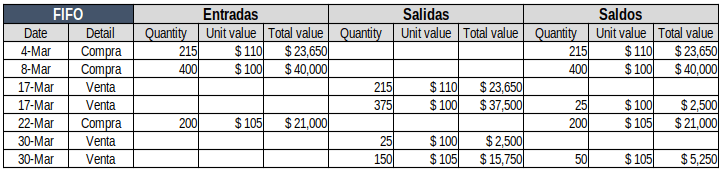
The cost of sales is calculated by adding up the sales of all periods. When added together, we obtain $79400.
LIFO example
- Same procedure as fiscal year PEPS
- Same procedure as the PEPS exercise. Bear in mind that the units of this purchase will be the first to be sold (because they are the last ones purchased).
- The sale of 519 units is generated, of which 400 units are sold first (the last to enter, those of March 8) for a value of $100 each, for a total of $40,000 in units sold.
- Then 190 units are sold for $110 (those left over from March 4) for $20,900. With this, we see that we have 25 units left over (215 left over – 190 sold) representing $2750.
In the same way we make the calculations for the movements of March 22 and 30.

Weighted average example
- We purchase 215 units at a price of $110, which gives us a value of 23,650. The balance in inventory we calculate the value of the unit by dividing the total cost by the number of units ($23,650/215 units). This gives us $110 per unit.
- 400 units are purchased at a price of $100 each, which represents a total value of $40,000. In balance we add both the units purchased and the balance to calculate the value per unit. In units we get 615 (215 units from the March 4 purchase and 400 from this purchase) which represents $63,650 ($23,650 from the March 4 purchase and $40,000 from this purchase). We calculate the value per unit by dividing $63,650 by 615 units, this gives us $103.5 per unit.
- 590 units are sold at just the price we calculated in the previous point (103.5). There are 25 units left in inventory (615 that were in balance – 590 from this sale). The total value in balance is $2,587 (63,650 from the previous purchase – 61,063 from this sale). The value per unit is obtained by dividing $2587 by 25.
We proceed in the same way for the other movements and this is what we get:

The cost of sales with the weighted average method is $79,408.
At this point, you may be asking yourself, why did I buy the units at one price and then the balance reflects another? The reason is in the cost of sales.
Download inventory valuation example
If when following the examples, you find ‘subtle’ differences in the figures, it is due to the decimal settings in Excel. Please download the solved exercise by clicking here. So you don’t get confused 🙂
You can download the Kardex format used in the exercise by clicking here.
Good explanation