Represent a problem, collaborate with your group, and ascertain its cause.
It is made feasible by the cause and effect diagram.
Along with Pareto, the cause-and-effect diagram, sometimes referred to as a Fishbone, fish diagram, or Ishikawa diagram, is possibly one of the most popular quality tools.
It entails the illustration of the root causes of a certain issue or circumstance.
It is especially helpful when there is a lack of quantitative data or while working in a group setting.
In today’s post, we’ll discuss what an Ishikawa diagram is, the many types, how to build one, the stages involved, and an example of an Ishikawa diagram.
The cause-and-effect Excel template is, of course, located at the end of the article.
What is a cause-and-effect diagram?
It is a tool that enables the visual representation of a problem or central focus and its causes, with the problem acting as the “head of the fish,” from which an important thorn protrudes.
The main reasons or big thorns come from there.
In turn, tiny thorns, also known as minor causes, might generate the huge thorns.
The fifth level of causes should be added to the Fishbone, according to its creator Kaoru Ishikawa.
Advantages of Ishikawa
The Cause – Effect diagram is perhaps one of the best known tools for the analysis of problems and their causes in order to propose possible solutions. There are many disciplines that practice it, because they find several benefits, among them:
- The shape of the diagram invites you to look for the causes underneath the causes, allowing you to go beyond the primary and secondary causes.
- Being based on the representation of a Fishbone, it facilitates teamwork. For example, you can work on a board with the Fishbone drawn on it and the members can place post-its.
- The shape of the diagram allows you to classify the causes in different ways, as we will see in the types of cause-effect diagrams, thus avoiding making mistakes by focusing on a single type of problem.
Ishikawa Diagram Types
We cannot claim that there are different kinds of Ishikawa diagrams; there is only one sort of Ishikawa diagram.
However, we have the following graphics based on how we create a fishbone.
Cause and effect diagram with 6m method
The process of creating a Fishbone diagram most frequently goes like this.
In fact, there are individuals who believe that talking about Ishikawa is equivalent to talking about the 6m and that there is life beyond the 6m, which in my opinion constitutes a failure in teaching and a waste of the Fishbone’s potential. What are the 6m?

- Manpower: We take into account all factors relating to people, employees, and labor. Independent of the issue, common queries include: Is the labor force trained? Is the appropriate staff chosen for the position? Are the employees driven and eager to work? Does the employee demonstrate skill in his work?
- Machinery: Infrastructure is discussed when talking about machinery. It is to discuss all the resources available to us for creating the finished product. Hardware, software, production equipment, forklifts, etc. Frequently asked questions include: Does it have the capacity to carry out its function? How productive is it? How is it dealt with? Exist spare parts? Is maintenance up to code? Is the most recent version available?
- Methods: We assess our procedures. Therefore, when we analyze methods, we are assessing whether the way we design the activities is yielding outcomes. As a result, we strive to identify the flaw in our techniques that is the root of the issue. Does the noise resemble labor? Yes, but let’s examine the distinction. The plant locations where we use a line production sequence and those that use a U-shaped sequence are distinct. Simply put, it’s how we make things without regard to the workers involved.
- Measurement: This is the umbrella term that encompasses all that we do in relation to inspection, including the many measures we use, quality control, calibration, sample size, measurement error, etc. For instance, comparing the performance of two sales groups based on the quantity of things sold and the quantity of sales achieved is not the ideal course of action.
- Materials: Materials used to create the final product as well as those utilized to clean the bathrooms are all subject to evaluation by the company. Everything is all there is. Suppliers, variations in material properties and standards, material compliance, workability, etc. are all often asked questions.
- Mother Nature: The circumstances and surroundings in which you work are referred to as the mother nature or environment. Mother nature factors such as light, heating, noise, snow, and corporate culture and climate are taken into consideration.
Process-Flow Diagram
In this instance, the process flow is used to create the fishbone. In other words, we create the primary fishbone using the steps or sequence of the process that is being analyzed.
Being clear about the process flow in terms of stages, activities, and tasks is a good approach.
Stratification method
When the main issue (the fish’s head) can be broken down into many root reasons that are closely tied to its nature, the main thorns become subcomponents of the main issue, which is highly helpful.
Consider an automobile-related issue as an illustration; the main challenges will be related to the various car components:
- The engine: spark plug, injector, sensor, gearbox, and other minor causes will be taken into consideration.
- Chassis: Consider the insignificant sources of this component:
headlights, tires, and shock absorbers, etc. - Interiors: Minor causes like air bags, horns, seat belts, etc. will be assessed.
- Exteriors: We inspect the doors, trunk, and mirrors.
Simple fish diagram
We tend to keep to established categories of causes, which is not always the best, and as a result, we occasionally forget that the cause and effect diagram is a flexible tool. The straightforward Ishikawa diagram allows us to create our own major and minor thorns, making it a completely unique diagram for the problem being studied.
For instance, a manufacturing firm may not have the same affinities as a process outsourcing company, and vice versa, so using the m’s technique to both could improve results for either.
Other techniques for creating a cause-and-effect diagram
There are specific categories of knowledge domains, including the 8p’s of marketing and the 4s’s of the service industry, in addition to the detections produced by quality controls and other mechanisms.
Eight p’s of marketing
The 4Ps have evolved into this. Your fish diagram would consist of the following in this scenario:
- People
- Positioning
- Process
- Performance
- Product
- Price
- Place or distribution
- Promotion or communication
4’s of the service industry
It is commonly applied in the service industry by considering the following aspects:
- Surroundings
- Skills
- Systems
- Suppliers
How to make an Ishokawa Diagram
Ishikawa diagrams are created through a brainstorming process that centers on a challenge or circumstance.
In this regard, brainstorming strategies that enable you to “squeeze” the most out of the guests may be helpful.
It might also be a good idea to pair it with other quality control tools, such check sheets for gathering pertinent information that will facilitate a more thorough root cause study.
Consider first creating the Ishikawa diagram in groups using paper, pencil, or a whiteboard. If you just insert the text box, arrange it, and start typing on a computer or other device, that’s probably not the best option. It is an idea generation process.
- Define and record the issue, circumstance, or incident you wish to analyze. You should write it down and then draw a box around it to represent the fish’s head. Don’t forget to describe the issue in terms of how it affects the context of the analysis. Draw a straight line (the central spine) down the left side of the text box after completing the previous step.
- List potential causes for the information written at the top of the diagram. A major spine generated from the central spine will be present in each of the observed causes (the line you drew in step 1). Depending on the nature of the issue, think about employing either the general causes (6m, 4s, 8p, etc.) or one of the above-described Ishikawa diagram development techniques.
- Analyze the problem from each of the major thorns. Ask yourself, in terms of cost, why does it “note the problem” if, for instance, you used the 8p’s of marketing to create your Fishbone. Place the answer along a line drawn from the primary herringbone.The second level of causes is this.
- Consider the second level of reasons when analyzing the issue: You will now use the response to the preceding question’s question and follow the identical steps with regard to the main issue. From the second level of causes, draw a line to where the solution is located. In terms of the notion of price, this is the third level of causes.
- As necessary, continue to delve further into the causes: Delve as far into the root causes as the issue will allow.
- Fill in the other likely causes: If you read step 2, you will notice that we are referring to the p of price. The actions we described in steps 2, 3, and 4 were solely taken for this key reason. Repeat this process for any key causes that you have determined. For the other 7 p’s, we would perform it in the same manner as step 2.
- If the group runs out of concepts, concentrate on the thorns where there are little concepts.
- Once the diagram is complete, examine the discovered causes to decide which ones require action: You undoubtedly have a variety of causes. We decide which issues are the primary causes and where we will intervene by vote or consensus. Here, we take into account variables including the frequency with which the cause arises, how it affects the main issue, and how much money, time, and effort will be needed to resolve it. Think about presenting this research to a larger group of people, including as management, investors, sponsors, etc.
Solved Ishikawa Diagram Example: Step by Step
For this solved example of Ishikawa diagram we are going to use a bench.
Step 1: The problem detected by the bank’s quality control department is: Very high waiting time for the bank’s users.
Step 2: Brainstorming, it has been decided to circle the problem from the categories that have been affecting the bank’s service the most. A review of the complaints and claims was sufficient to have information to define them. Consequently, the major thorns are:
- Service personnel
- System
- Service Capability
- Method
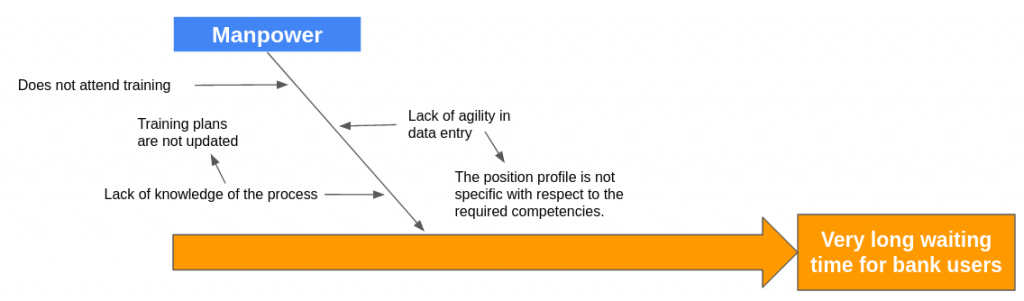
Step 3: Let’s take the biggest thorn: People.
Question:
- How does it affect the bank’s staff that the waiting time for users is very high?
- In terms of staff, why is there a very high waiting time for users?
- At what point does the bank’s staff make the waiting time for users very long?
As you can see, any question that relates the aspect you are analyzing to the central problem will allow you to define causes.
Thus, these answers have been obtained:
- Staff does not attend training
- The staff is not familiar with the process
- The staff is not agile in the typing process
Step 4: We go deeper to the next level looking for the causes of the answers obtained in step 3.
- The staff is not familiar with the process BECAUSE the training plans are based on the previous software, i.e. they are not up to date.
- The staff is not agile in typing BECAUSE this competence was not taken into account when hiring them. Observing the position profile, this is not a competency that is included.
Step 5: We perform the same process with the other causes or major spines. The finished diagram looks as follows:
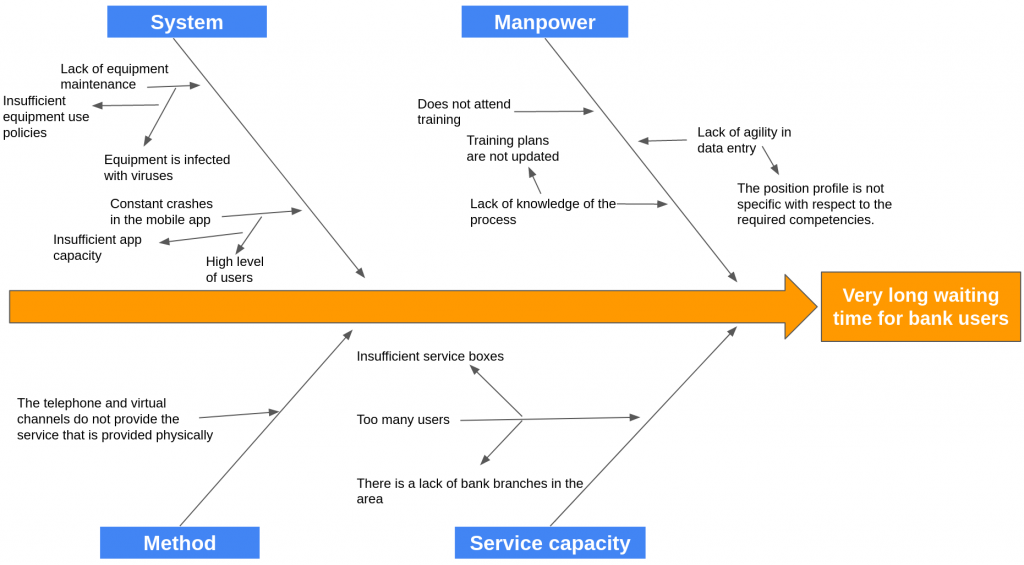
To go deeper into their causes, it would be a good idea to review method and service capacity.
Keep in mind that when examining the causes, what began with one category may subsequently be connected to another area.
For example, when going deeper into the system causes, it is observed that the high number of users is one of the causes for the crashes in the mobile application, this makes sense if we look at the service capacity thorn, where it can be seen that more branches are needed in that area and insufficient service boxes for the bank.
Is there a connection? Of course there is. You already have an idea of what the solution might be.
By way of conclusion, we can mention that the main cause revolves around the insufficient service capacity of the bank from the different channels it has: its virtual, telephone and physical channels.
The following areas are potential targets for intervention:
- Decide which requests are made the most frequently, and add them to the phone and online service channels.
- Define the population covered by the bank’s branch and consider whether another branch could support the current one.
- Redesign the interior design of the bank’s facilities or expand them to accommodate more service providers.
- Increase the number of users who can use the mobile application concurrently by intervening with the servers that facilitate its use.
Ishikawa template in excel
a
Fuente de imagen: La imagen destacada del post es: Icons made by Freepik from www.flaticon.com is licensed by CC 3.0 BY